- support@skola24.com
Frånvarostatistik - Absence statistics
Skriv utThe option Frånvarostatistik (Absence statistics) gives principals and head departments the opportunity to quickly obtain visual statistics for the school, municipality or organization. The report shows trends, patterns and deviations where the smallest unit is the school. The data that can be followed up are teachers' reporting rate, valid and unauthorized absences, differences between girls and boys and the difference between schools.
- The option Frånvarostatistik exists as a licence on the database level and includes all schools.
- Already when the licence is activated statistics can be retrieved three years back in time.
- Lesson time and absences are calculated on the school where the lesson takes place.
Statistics presented
Absence per month during three years back in time
Absence in percentage of the lesson time
- average value for each individual school
- aggregated average value for all selected schools
Absence statistics are presented as:
- total, valid and unauthorized absence
- divided by gender
Reporting rate total and per school
- percentage of lesson time reported by at least one person
Who has access to the overall absence statistics
A person having the user role Systemansvarig centralt (kommunadministratör) has access to absence statistics for the whole municipality/organization.
A person having the user role Systemansvarig skola (skoladministratör) e.g. a principle has access to absence statistics for the school/schools that he or she is connected to in the system.
Absence statistics for one, several or all schools
Log in to Skola24 and select Sammanställningar on the home page,
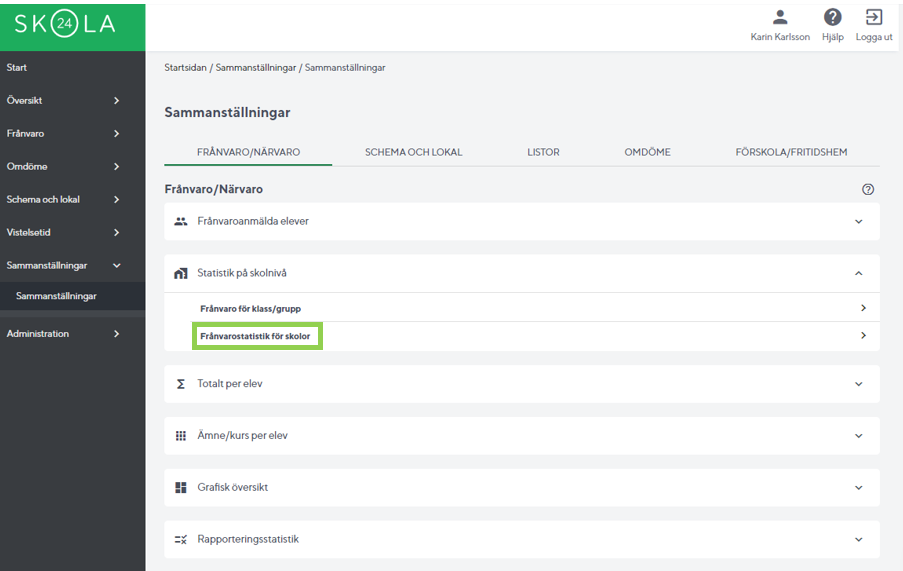
Under Statistik på skolnivå click on the option Frånvarostatistik för skolor
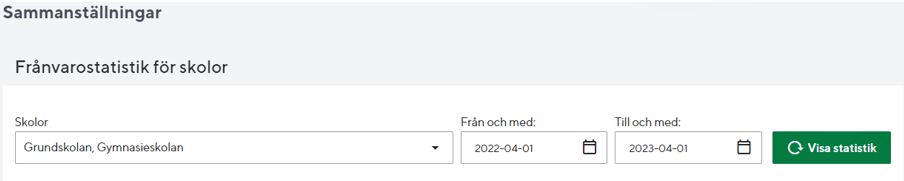
Select one, several or all schools in the scrolling list and enter the date interval that the statistics should be calculated on.
The statistics can be displayed for a maximum of three years back in time, the current academic year plus the two most recently completed academic years. No statistics for the current week are included in the report.
Click on the button Visa statistik.
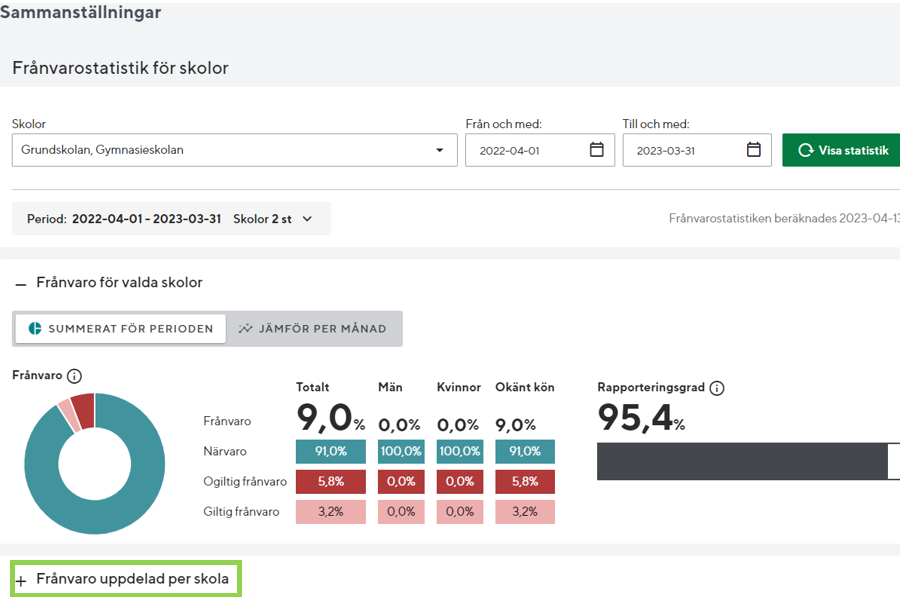
Absence statistics for the selected date interval is presented as a pie chart as well as in table form with the values Frånvaro (Absence), Närvaro (Presence), Ogiltig frånvaro (Unauthorized absence) and Giltig frånvaro (Valid absence) divided into Totalt, Män (Men), Kvinnor(Women) and Okänt kön (Unknown gender). The figures show the average value for the schools selected to be included in the report.
The average value of Rapporteringsgraden (the Reporting rate) for represented schools is also presented in the report.
Absence statistics divided per school
The statistics can be obtained separated per school by rolling down the window Frånvaro uppdelad per skola.
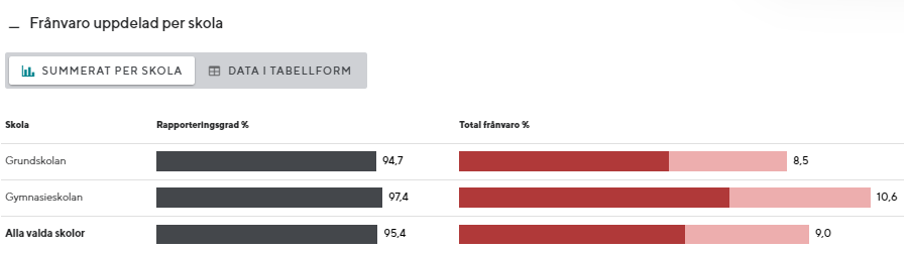
Absence per school can be presented either as SUMMERAT PER SKOLA or as DATA I TABELLFORM.
The table SUMMERAT PER SKOLA displays only the average value in percent for the single school's Rapporteringsgrad (reporting rate) and Total frånvaro (total absence).
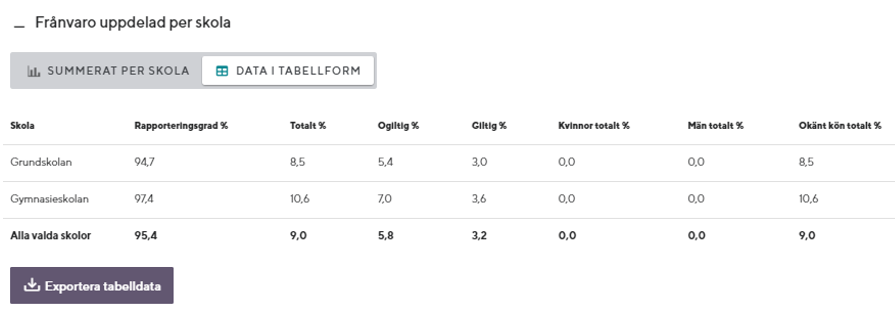
The option DATA I TABELLFORM displays more figures for the single school. You will here find also the average values for Ogiltig (unauthorized), Giltig (valid), Kvinnor totalt (total of women), Män totalt (total of men) and Okänt kön totalt (total of unknown gender) in percent.
From this view table data of the absence statistics can be exported to Excel or other spreadsheet program through the button Exportera tabelldata.
Absence statistics per month
Absence statistics can also be obtained divided per month for a selected date interval through the option JÄMFÖR PER MÅNAD.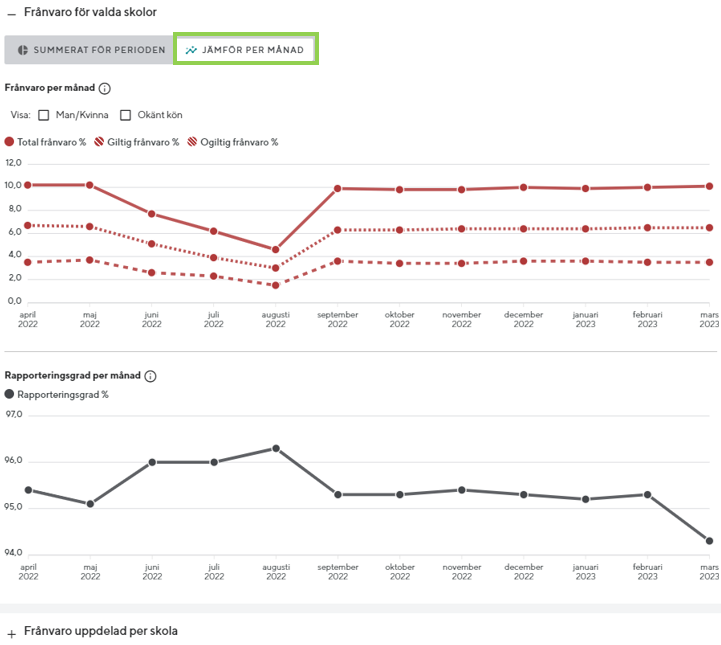
The values displayed in the report are the average values in percent for the schools selected to be included in the report. By moving the cursor along the x-axis (calendar data), the current values for Total frånvaro (Total absence), Giltig frånvaro (Valid absence) and Ogiltig frånvaro (Unauthorized absence) in percentage for the month the cursor is pointing to are displayed. The same applies if the cursor is moved along the x-axis of the Rapporteringsgrad per månad (Monthly reporting rate). The values shown in the charts are average values in percentage for the schools chosen to be included in the report.
Uppdaterad 25 september 2023
Skriv ut